Serverless Data Analytics On AWS (QuickSight + Athena + Glue + S3 Data Lake)
The term "serverless" is becoming very popular in the world of Big Data. The rise of cloud computing is fast democratizing the approach and method by which we store, process, and analyze vast amounts of data. Gone are those days when organizations have to set up large farms of physical servers and storage devices on-premises just to be able to store and process large datasets at speed.
The primary advantage that serverless data analytics architectures offer is the ability to store and analyze a huge amount of data in a highly durable, secure, and scalable manner without the headache of managing and monitoring the performance of the underlying infrastructures. Also when it comes to security and cost of maintenance, the advantage of moving your organizations' data analytics and storage system to the cloud would always outweigh doing so on-premises.
Serverless Data Analytics on AWS
According to the report on cloud market share in 2020 by Statista, AWS alone accounts for 33% of the entire cloud market with other cloud services providers such as Azure (18%), Google Cloud (9%), Alibaba Cloud (6%) and many more behind them.
As regards data analytics on the cloud, AWS has the broadest and deepest portfolio of purpose-built serverless analytics tools to help you quickly get insights from your data using the most appropriate tool for the job.

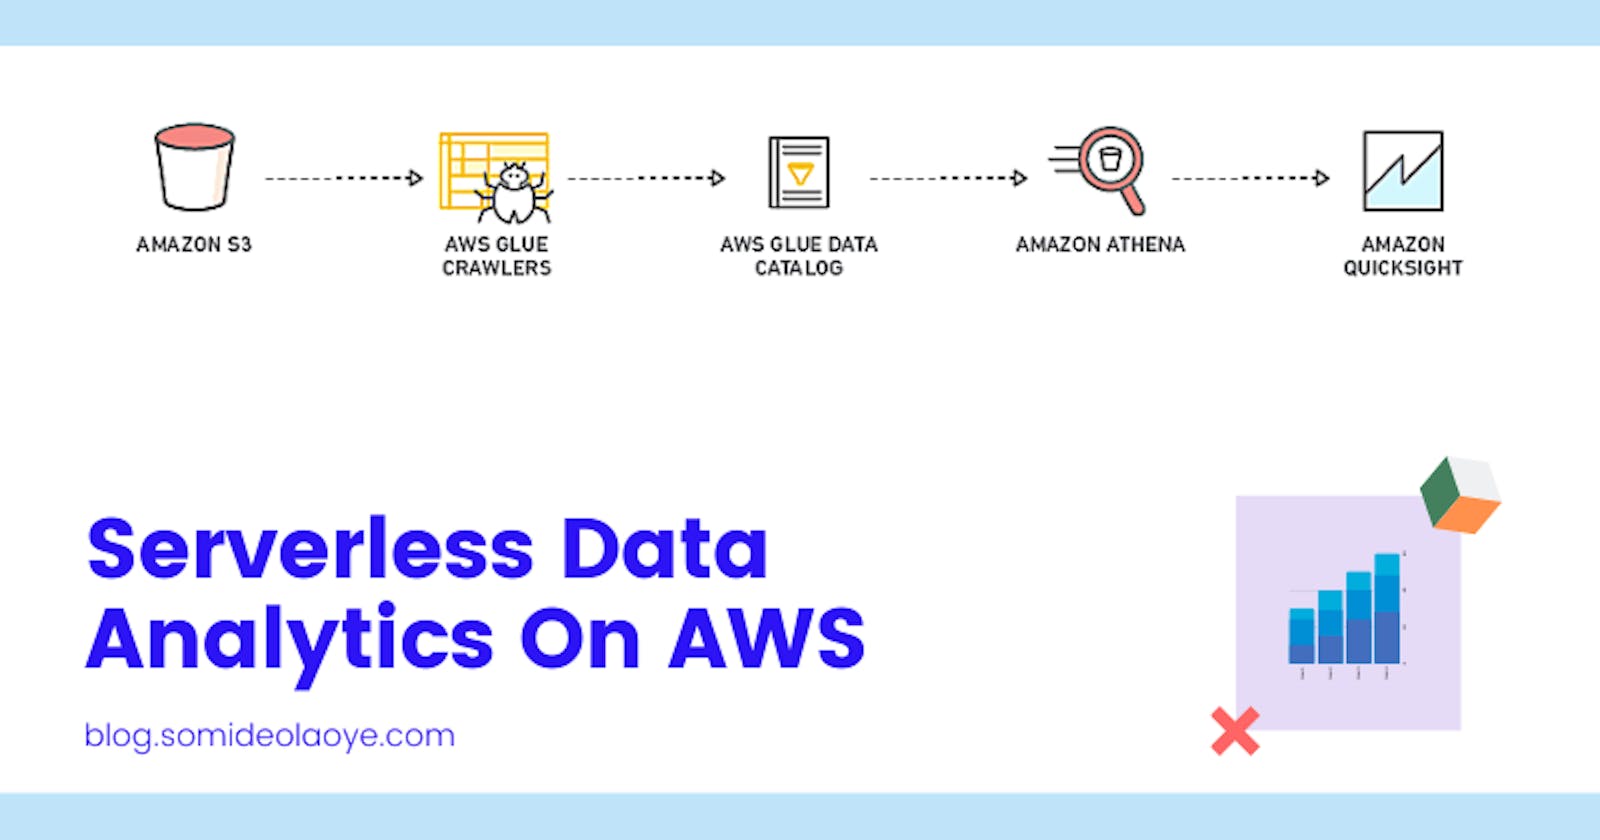
The diagram above is a simple data analytics architecture (completely serverless) that can be implemented on AWS mostly for batch processing and analysis of data stored in a data lake like S3.
Before I proceed further, let me quickly introduce you to the tools that make up the above serverless data architecture:
Amazon S3: is object storage built to store and retrieve any amount of data from anywhere. S3 is a perfect choice for building a massive data lake on AWS. S3 helps to decouple storage from compute and data processing and can integrates with a broad portfolio of tools on AWS.
AWS Glue: is a fully managed extract, transform, and load (ETL) service that makes it easy to prepare, transform, and load your data for analytics use cases. AWS Glue is made up of the Glue Crawler for automated schema discovery and Glue Data Catalog which is a persistent metadata store for the discovered schemas.
Amazon Athena: is an interactive query service that makes it easy to analyze data in Amazon S3 using standard SQL. You can use Athena to query AWS Glue catalog metadata like databases, tables, partitions, and columns.
Amazon QuickSight: is a fast, cloud-powered business intelligence service that makes it easy to deliver insights to everyone in your organization.
Analyzing Data Stored in S3 Data Lake
In this particular exercise, we are going to look at how AWS Glue can be used to automatically discover the schema of CSV data stored in an S3 bucket and how we can run SQL queries directly on the data in S3 without having to copy or move the data from its location. And finally, we are going to make use of Amazon QuickSight to create simple visualizations and reporting dashboard for our dataset.
[Important!] You may incur some charges by following the steps in this tutorial as some of the tools used are not within the AWS Free-Tier limits. Also, the procedures and steps in this tutorial are not a fit for people that are completely new to AWS, and a basic understanding of how to use the AWS management console and how the services mentioned above work is needed to be able to fully follow along.
1. Download dataset from Kaggle
To get started with the exercise, we need to get data that we are going to analyze. The data that I have chosen for this purpose is the Netflix Movies Title dataset on Kaggle. The dataset consists of over 6,200 records of TV Shows and Movies available on Netflix as of 2019. The data is less than 3MB in size and is readily available in CSV data format.
Download the data from the Kaggle website by following the link above. Once the download is complete, unzip the "archive.zip" and have the data ready to be uploaded to the Amazon S3 bucket that we would be creating in our next step.

2. Upload the downloaded data to S3 Bucket
Amazon S3 is the largest and most performant object storage service for structured and unstructured data and the storage service of choice to build a data lake. With a wide range of features, Amazon S3 is the ideal service to build and manage a data lake of any size and purpose on AWS.
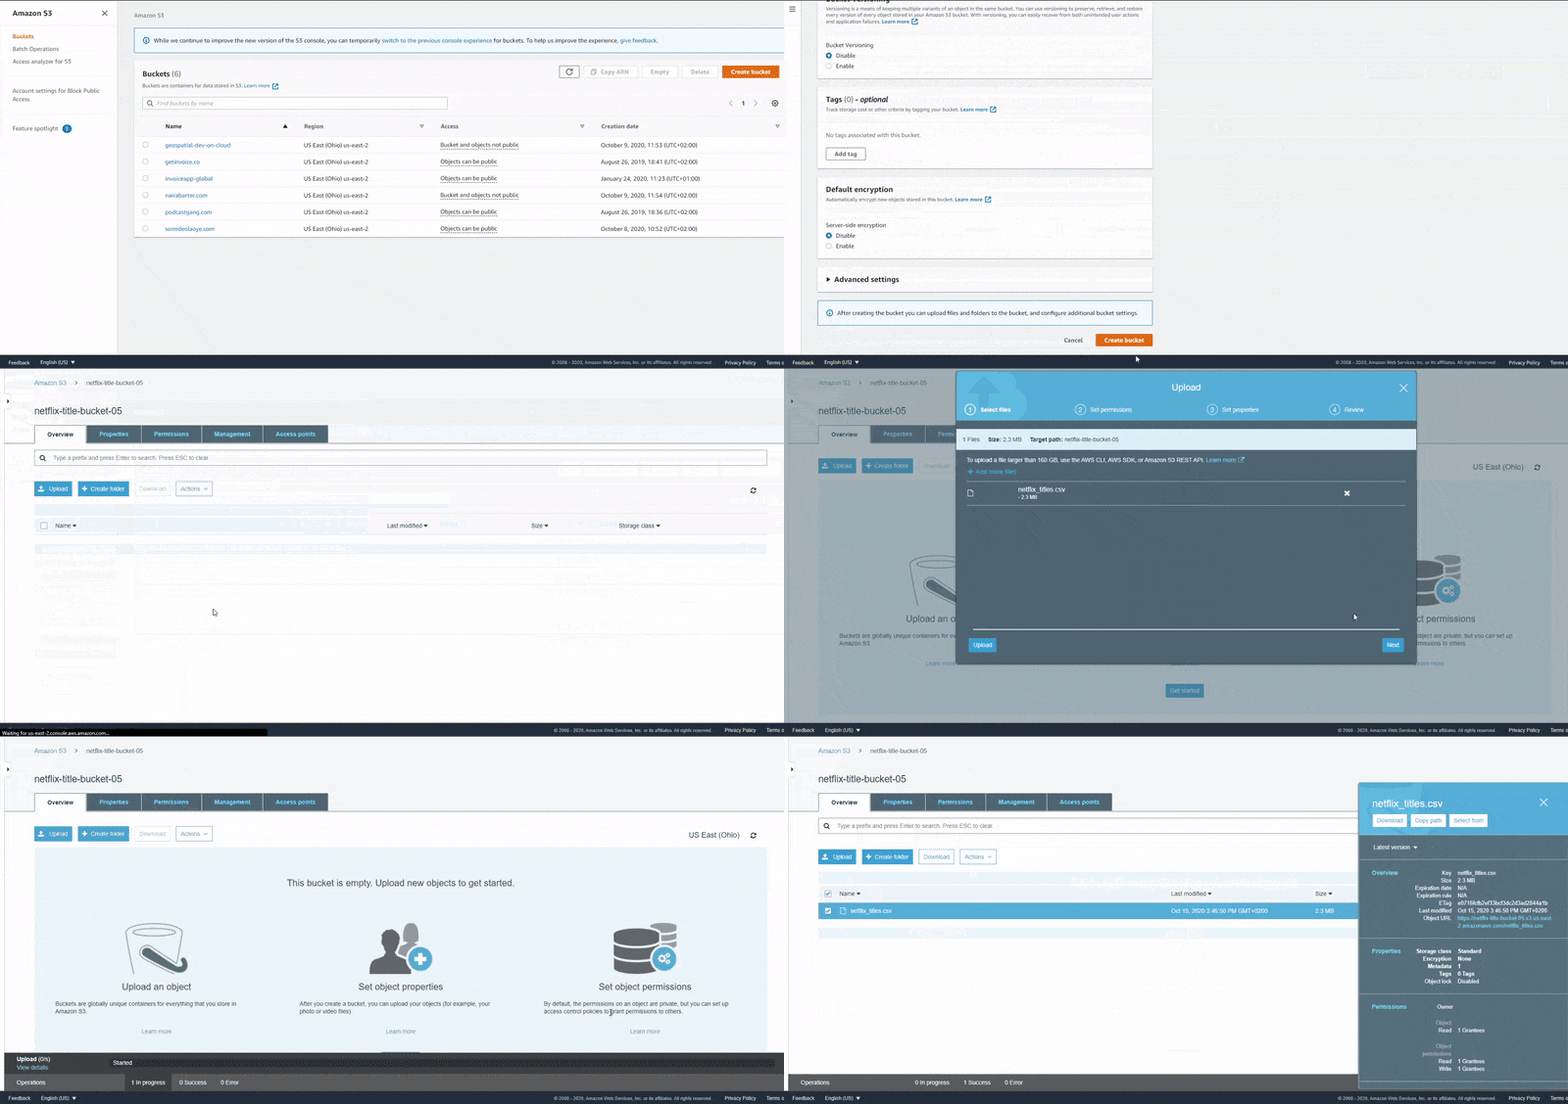
For the purpose of this tutorial, we are going to use Amazon S3 as the storage location for our source data. Before you can upload data to Amazon S3, you must create a bucket in one of the AWS Regions to store your data. After you create a bucket, you can upload an unlimited number of data objects to the bucket. As shown in the animation below, we are going to first create a bucket in Amazon S3 and then upload the CSV data from our initial step into the newly created bucket.
In the next step, we are going to use AWS Glue to crawl the schema information of the dataset in S3 and store the crawled information in a Glue Data Catalog.
3. Crawl and catalog S3 data with AWS Glue
AWS Glue is a fully managed ETL (extract, transform, and load) service that makes it simple and cost-effective to categorize a vast amount of data, clean it, enrich it, and move it reliably between various data stores and data streams. With a few clicks in the AWS console, you can register your data sources, and then have AWS Glue to crawl the data sources to construct a data catalog using metadata (for table definitions and schemas).
AWS Glue consists of two major components (Glue Crawler and Glue Data Catalog) that are needed for this exercise. The Glue Crawler as the name implies automatically crawls our Amazon S3 Bucket and populates the Glue Data Catalog with tables definitions and schema information that was inferred from the content of our Amazon S3 bucket.
To create the crawler that would crawl our source data, we need to navigate to the "Crawler" tab on the AWS Glue page in the web console and click the "Add Crawler" button.

On the "Add Crawler" page, input the proposed name of your crawler, select the crawler source type as "Data store", and select S3 as the source with the URL path of the bucket or folder that contains our CSV data. Create an IAM Role that would be used by AWS Glue to interact with Amazon S3 and select the "Run On Demand" schedule option since we only want to execute the crawler once. Select the database where the output of the crawler would be stored, review the settings once done, and click the "Finish" button to save the crawler.
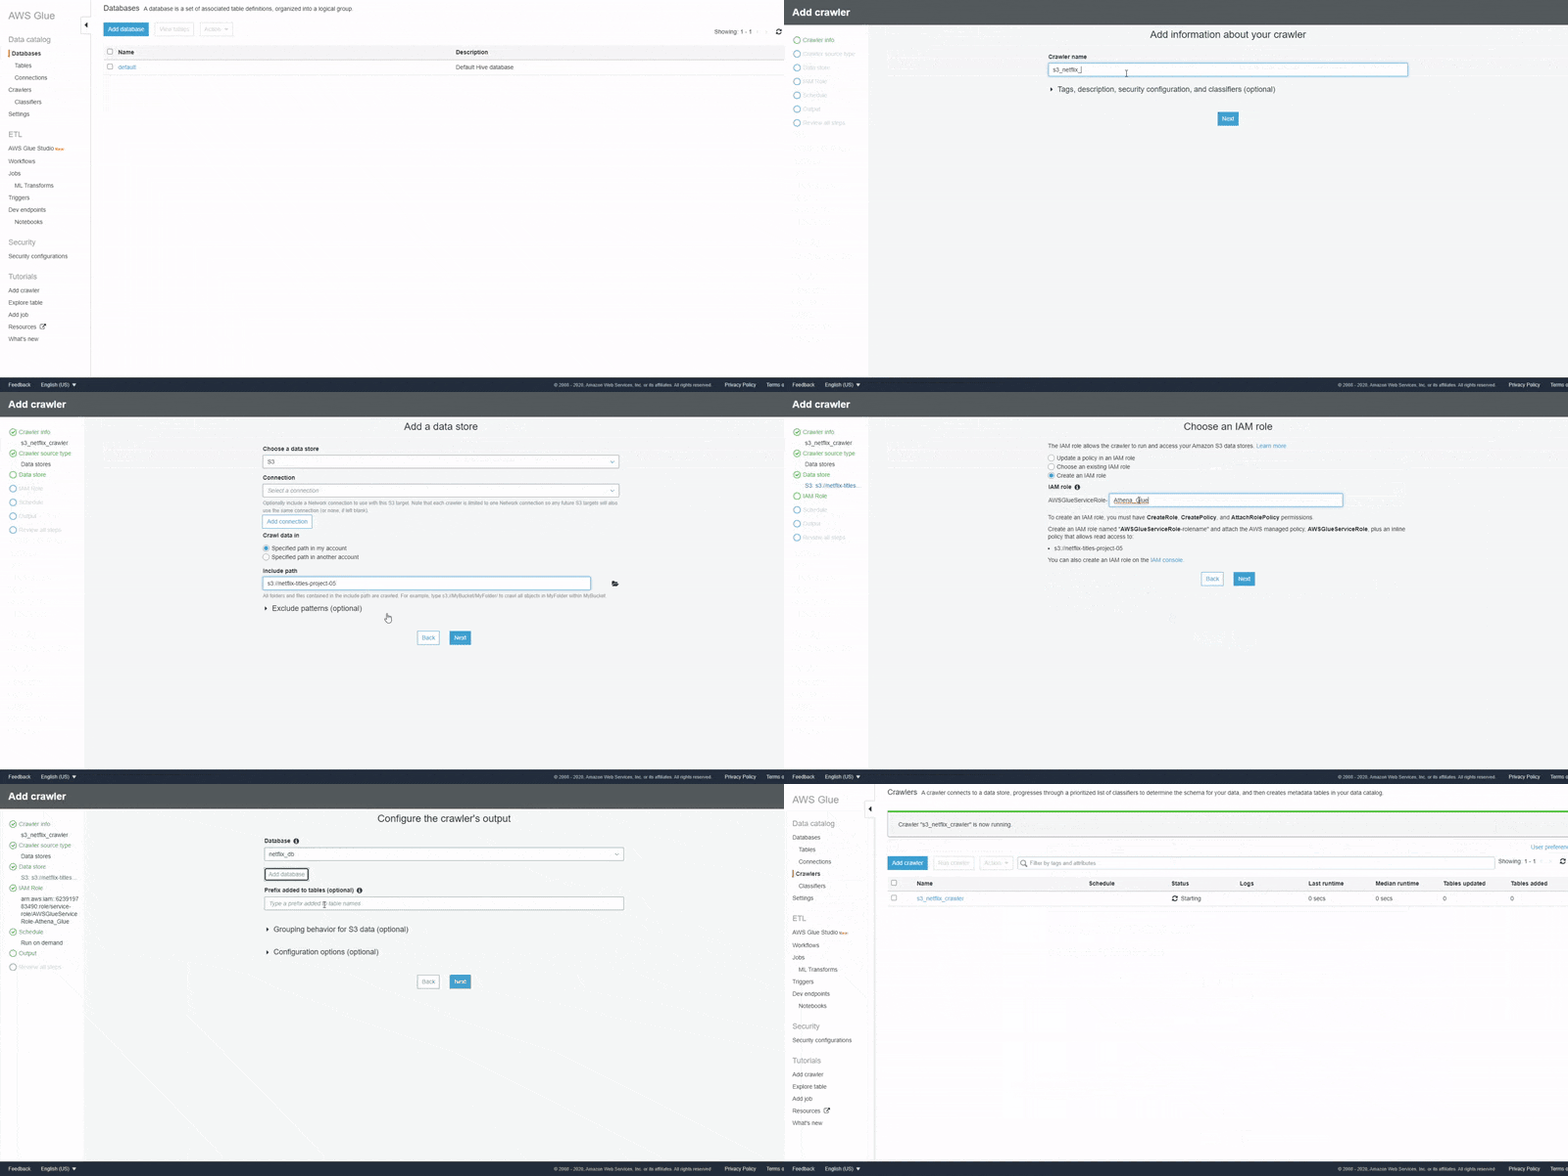
Once the crawler has been created, select the crawler and click the "Run Crawler" button. Upon completion, the crawler creates one or more tables in our Glue Data Catalog.
Now that the table has been created, the data in Amazon S3 is ready to be queried directly with Athena. Amazon Athena natively supports querying datasets and data sources that are registered with the AWS Glue Data Catalog.
4. Run SQL queries with Amazon Athena
Amazon Athena uses Presto with full standard SQL support and works with a variety of standard data formats, including CSV, JSON, ORC, Apache Parquet, and Avro. While Amazon Athena is ideal for quick, ad-hoc querying and integrates with Amazon QuickSight for easy visualization, it can also handle complex analysis, including large joins, window functions, and arrays.
You can run SQL queries using Amazon Athena on data sources that are registered with the AWS Glue Data Catalog and data sources that you connect to using Athena query federation, such as Hive metastores and Amazon DocumentDB instances. Athena saves the results of a query in a query result location that you specify (such as S3 Bucket). This allows you to view query history and to download and view query results sets.
To run SQL queries against the data that was cataloged in the previous step, we need to navigate to the Athena page on the AWS console and select Glue Data Catalog as a data source. Once this is done, you would see a dropdown of the databases that we have created in AWS Glue, select the database that was created in the last step to be able to see the table that was created from the last step.
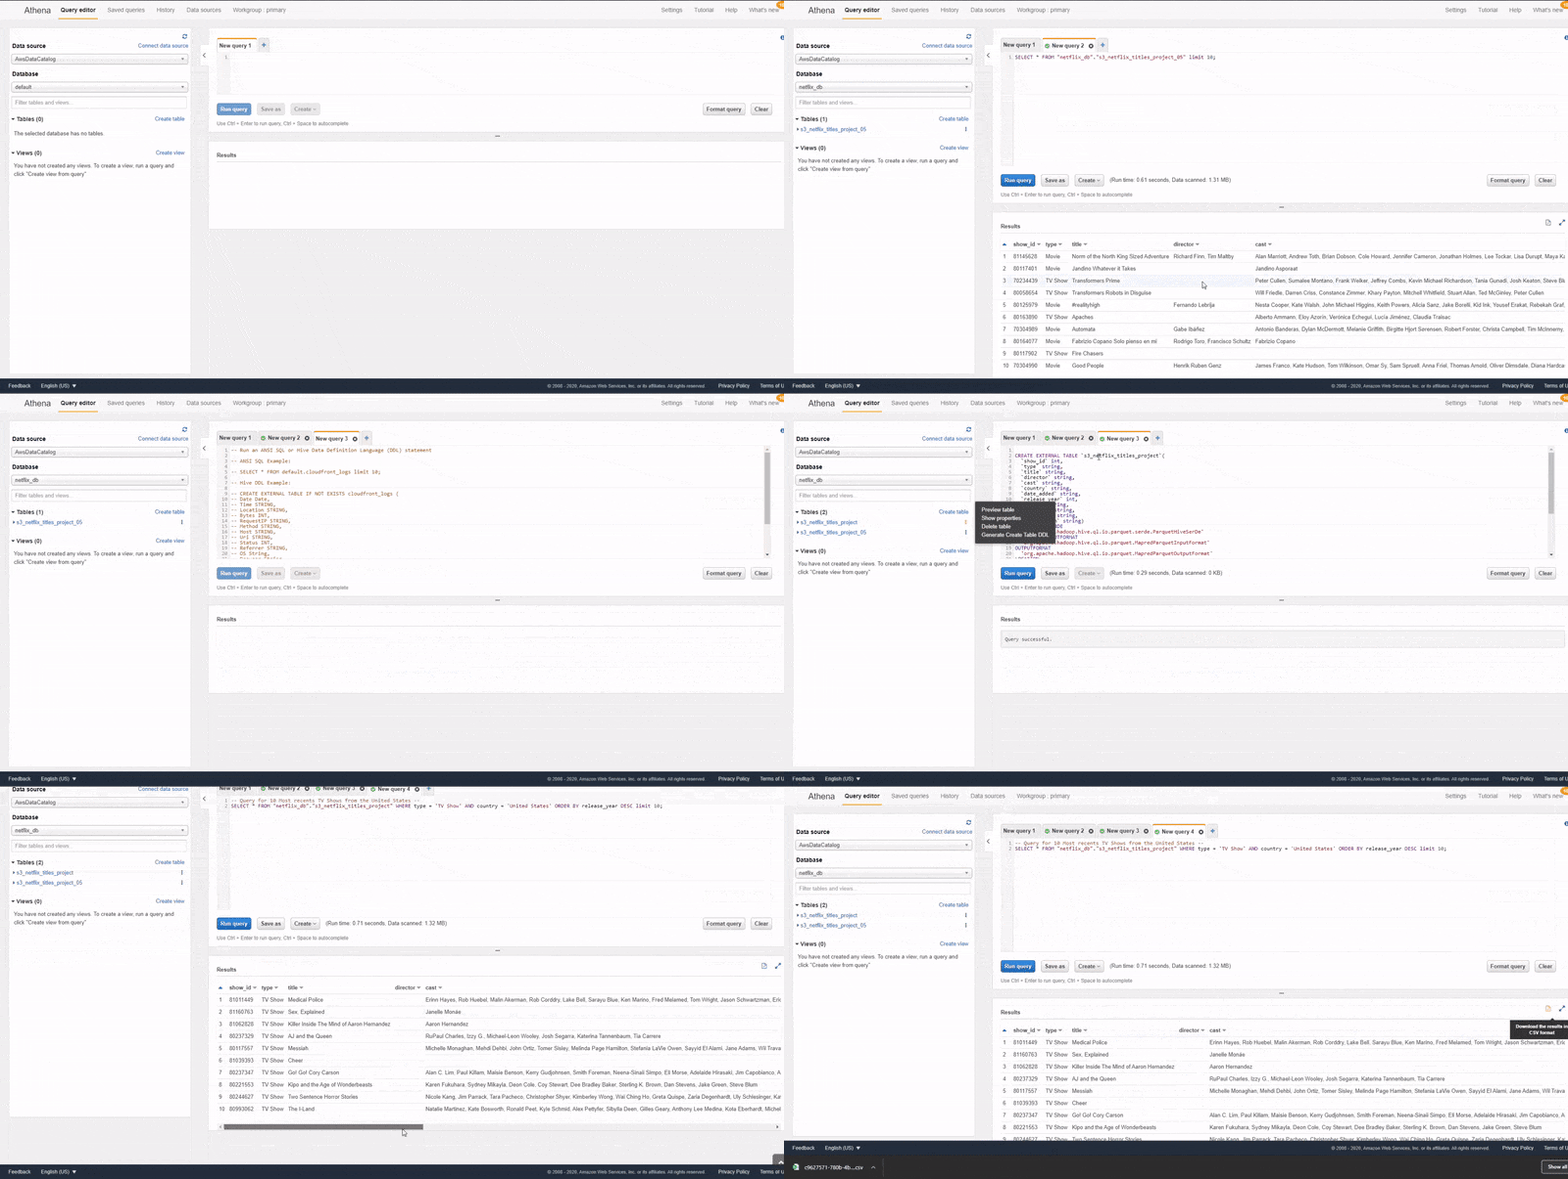
As shown in the animation above, we can run SQL queries against our tables by making use of the query editor in Athena. The results of the queries would be displayed in the section below the query editor. Also, Athena also gives us the option to download the results of our queries in CSV.
5. Create visualization with Amazon QuickSight
Amazon Quicksight is a Business Intelligence (BI) tool for creating quick and powerful visualizations on large datasets. QuickSight can connect to a variety of data sources that you can use to provide data for your analyses including Amazon Athena.
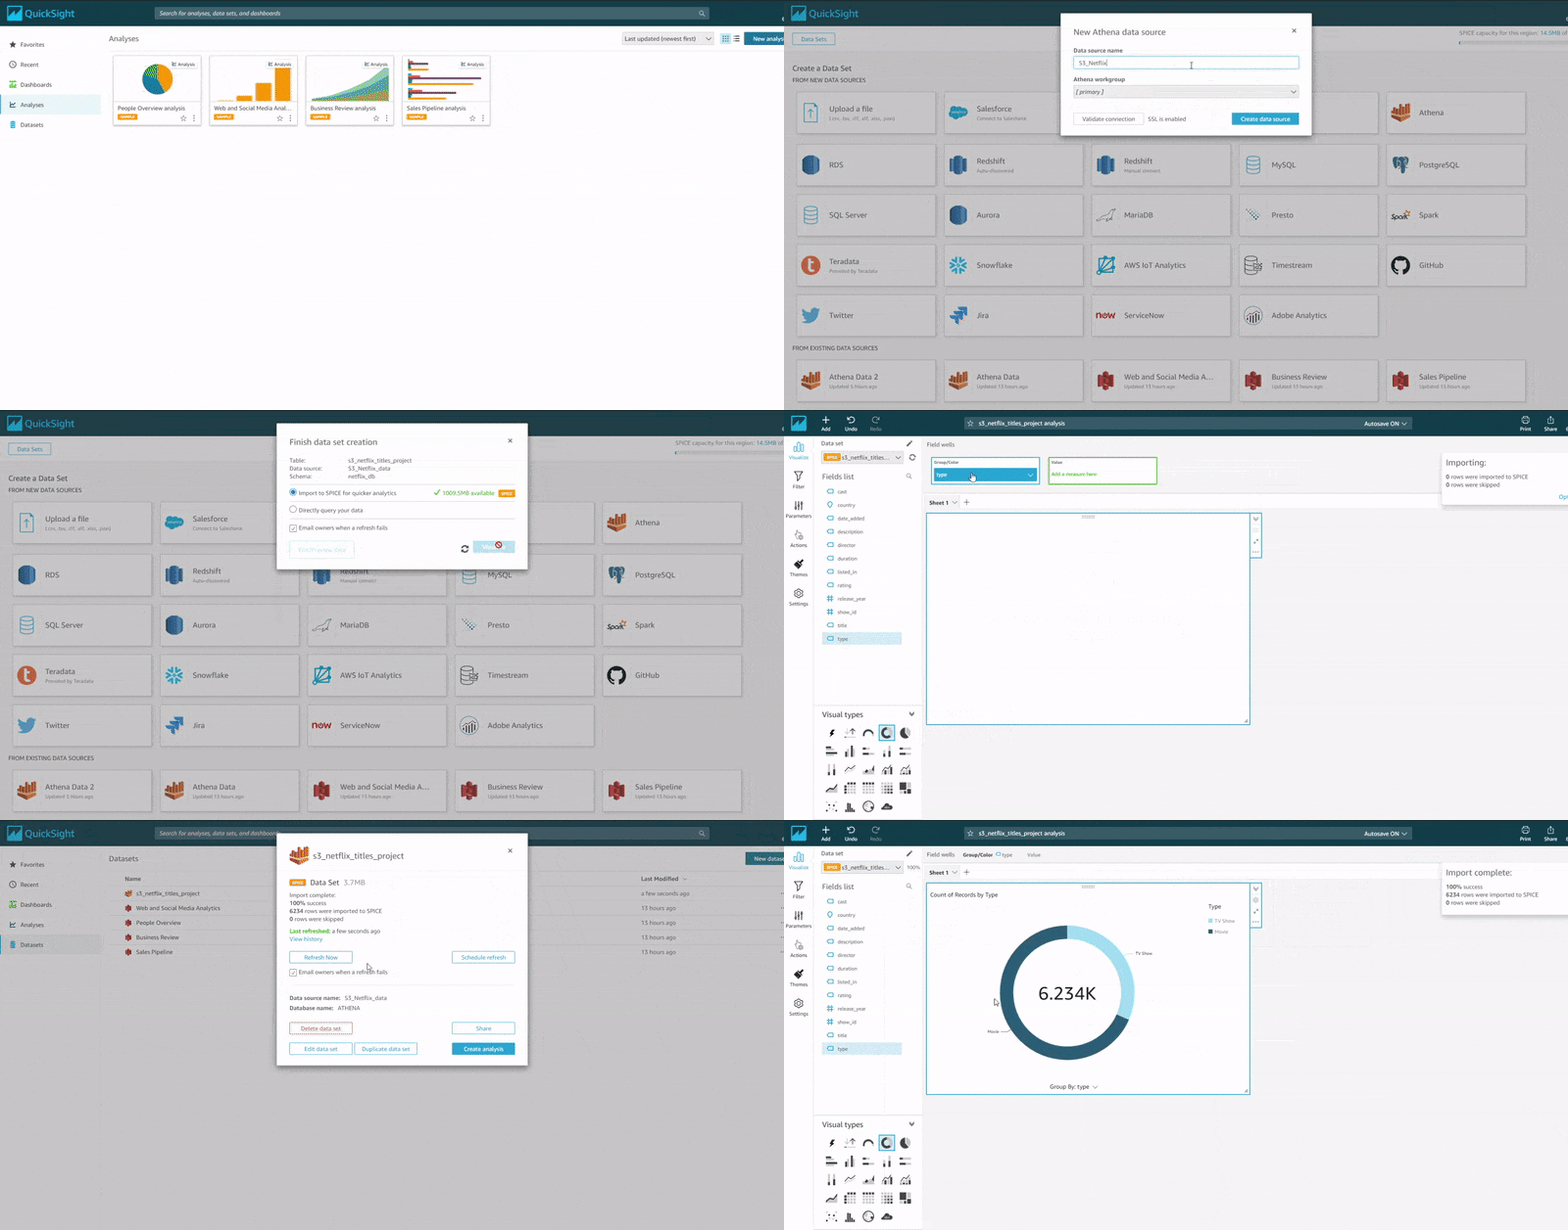
For the purpose of this exercise, we are going to visualize our data by connecting QuickSight directly to Amazon Athena. Once a connection is established with Athena, we can then import the data into QickSights SPICE. SPICE is the Amazon QuickSight Super-fast, Parallel, In-memory Calculation Engine, engineered to rapidly perform advanced calculations and serve data.
The animation below shows the procedure for connecting QuickSight to Athena and importing the data into SPICE for analysis.
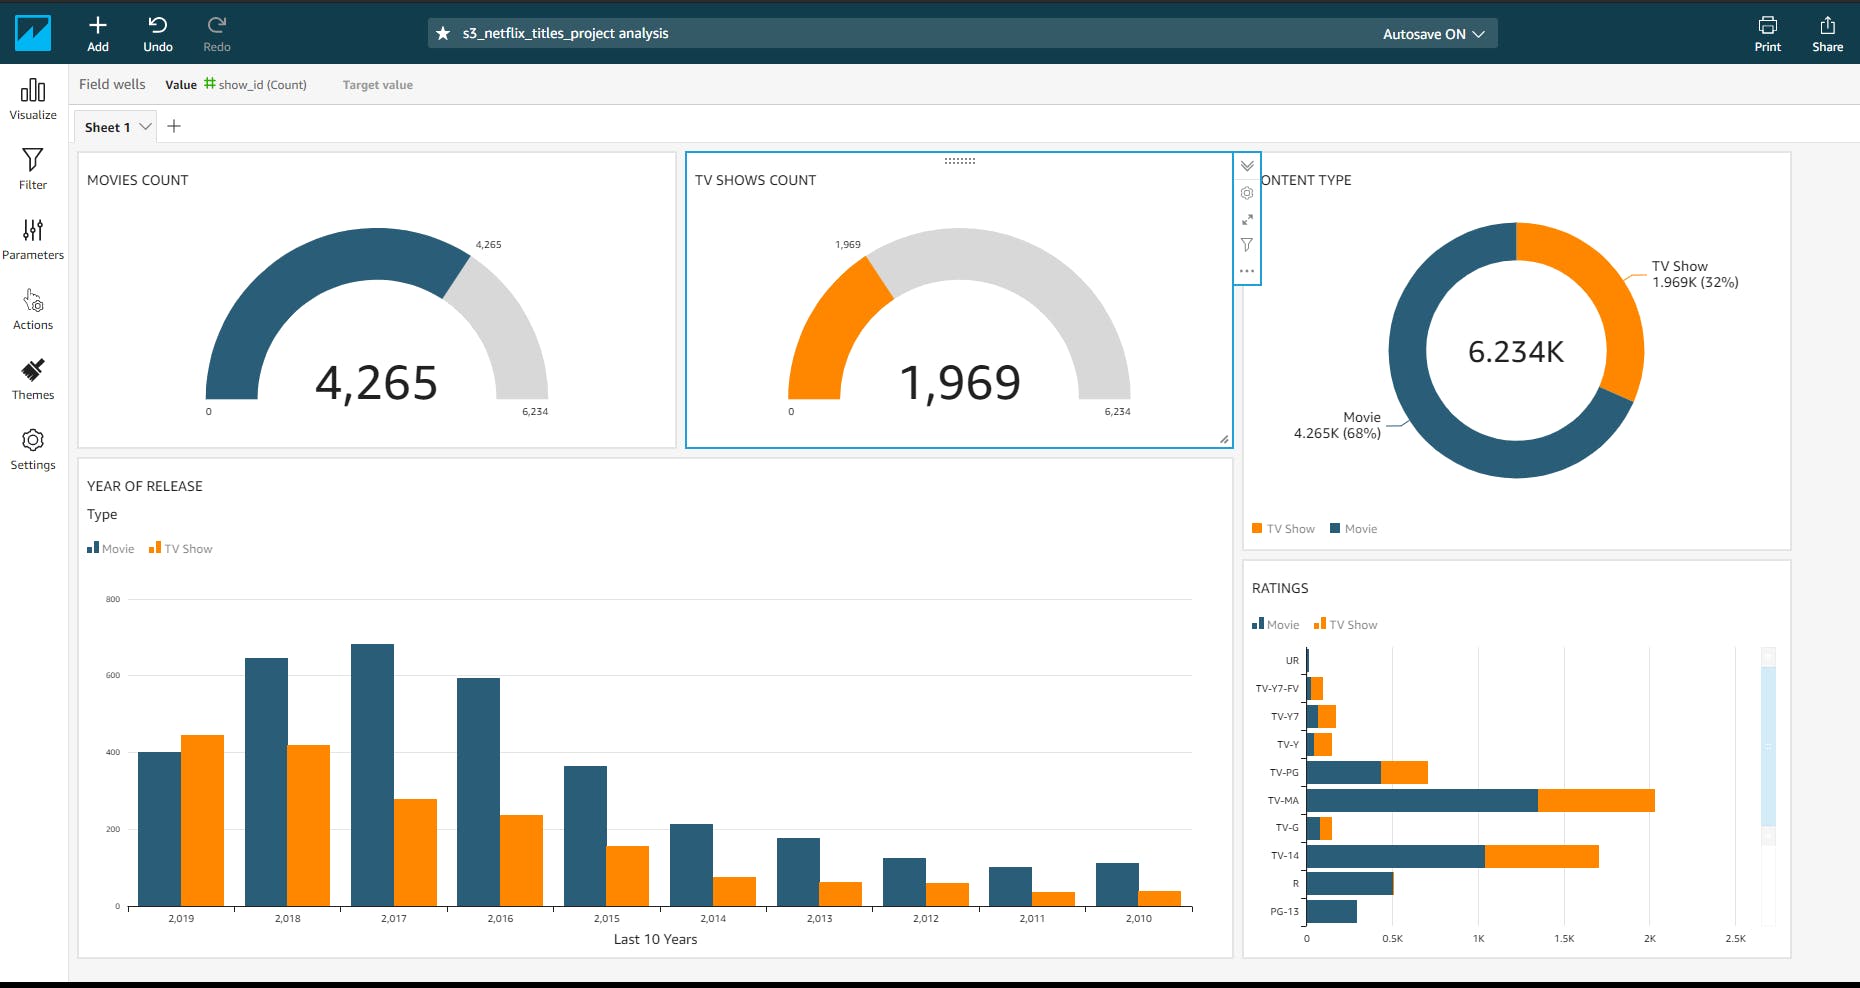
By playing around with the dataset imported from Amazon Athena and the several visual types supported by Amazon QuickSight, I was able to come up with a quick but simple visual representation of our dataset. The report can be shared in various means or embedded on a webpage.
Conclusion
What I've done in this exercise is just a fraction of what can be achieved with data analytics on AWS. Building a successful data analytics platform is not just about having the right data and skills but also having the right set tools to be to turn such information into viable insights that support critical business decisions within the organization.

