Analyzing Geospatial Data with BigQuery GIS

Location! Location!! Location!!! In today's world of data science and machine learning, the answer to many critical business decisions revolve around location data. A significant portion of business data that is collected today contains one or more types of location information.
For example, you may record the latitude and longitude of your delivery vehicles or packages over time. You may also record customer transactions and join the data to another table with store location data. You can use this type of location data to determine when a package is likely to arrive or to determine which customers should receive a mailer for a particular store location.
In general terms, datasets that contain location information are referred to as geospatial data. Geospatial data includes different types of location information such as GPS coordinates, zip codes, addresses, etc.
What is BigQuery?
BigQuery is Google Cloud's fully managed, petabyte-scale, and cost-effective analytics data warehouse that lets you run analytics over vast amounts of data in near real-time. BigQuery is serverless which means there's no infrastructure to set up or manage, letting you focus on finding meaningful insights from your data.
Googles BigQuery has amazing features and functionalities that make it outstanding even when compared with a top data warehouse tool like AWS Redshift. Aside from BigQuery GIS which provides some GIS capabilities on working with large datasets, BigQuey also includes a machine learning feature (BigQuery ML) which makes it easy to develop machine learning models on large datasets using just standard SQL.
Introduction to BigQuery GIS
Google's BigQuery is a data warehouse tool with first-class support for GIS functions and data types. BigQuery GIS lets you analyze and visualize geospatial data in BigQuery by using geography data types and standard SQL geography functions.
You can visualize your BigQuery GIS Data using BigQuery Geo Viz . BigQuery Geo Viz is a web tool for visualizing geospatial data in BigQuery on a map, one query at a time. You can run a SQL query and display the results on an interactive map.
When you use BigQuery GIS, your charges are based on how much data is stored in the tables that contain BigQuery GIS data (storage pricing) and the amount of data scanned by the queries you run against the data (query pricing).
BigQuery GIS Functions
BigQuery supports many GIS functions that can be used to analyze geographical data. For the purpose of this tutorial, we made use of the 3 most commonly used BigQuery GIS functions to analyze some publicly available datasets on Google Cloud.
Analysis 1 (ST_AREA)
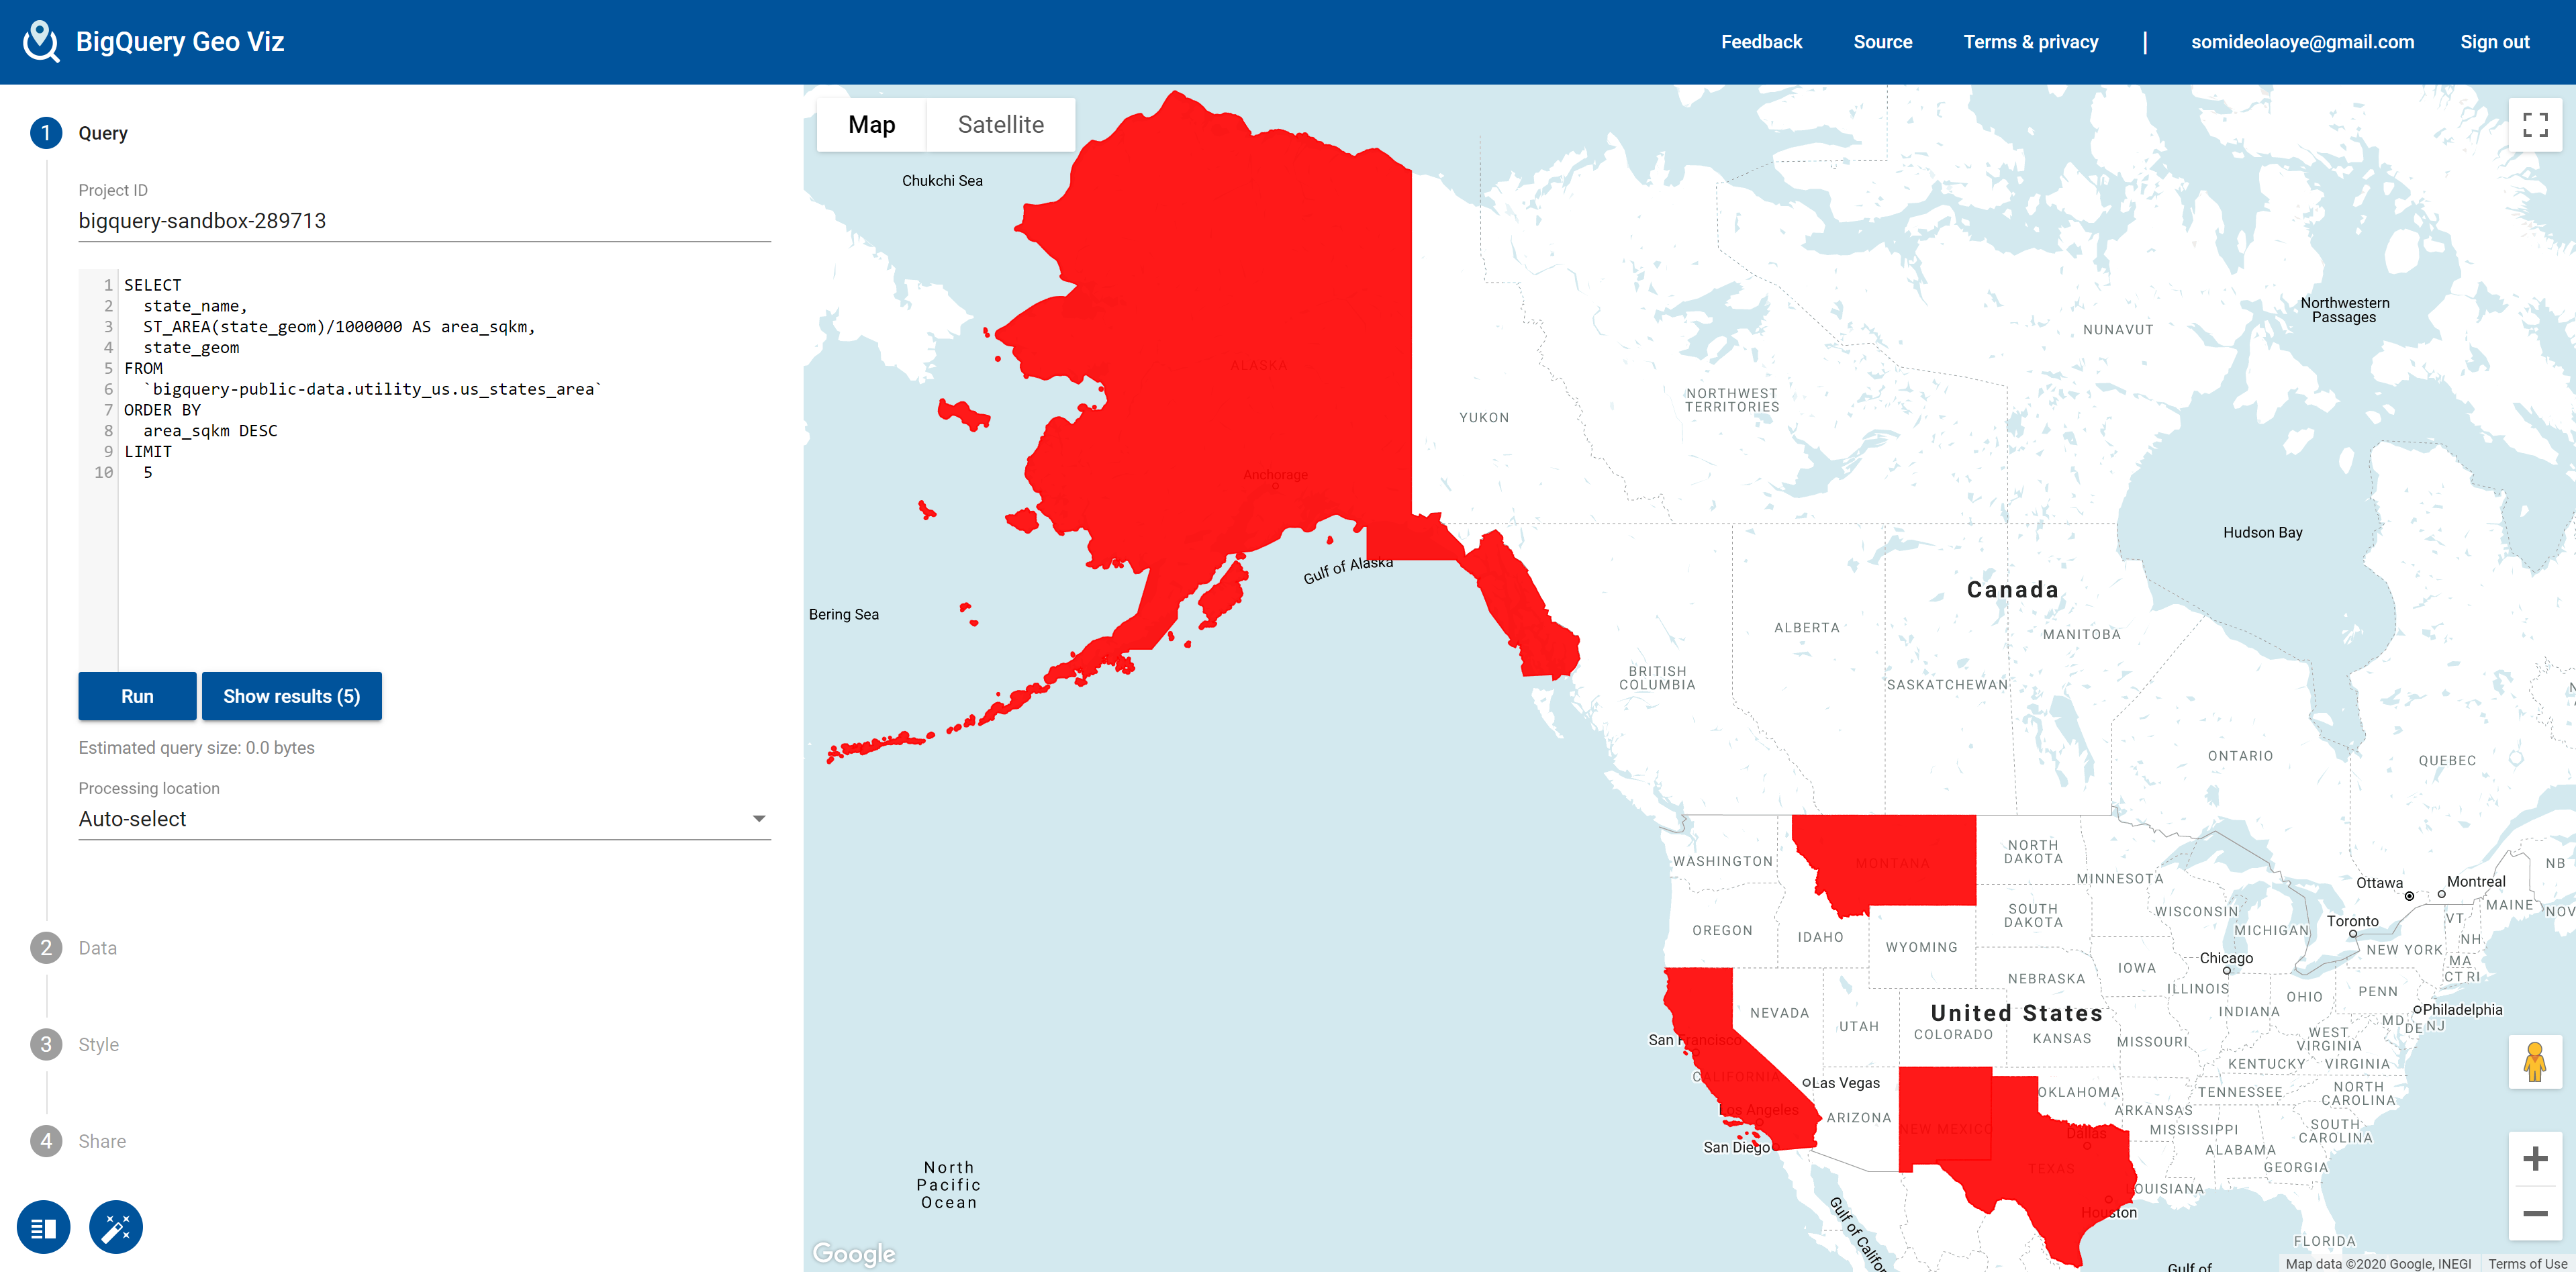
Objective: To determine the five largest states in the United States.
Given the geometry (state_geom) of all the states in the United State, we are able to calculate the area of each state in square kilometers (sq.km) using the ST_AREA BigQuery GIS function.
This function returns the area in square meters covered by a given geometry. As seen in the SQL statement below, the area was then converted from square meters to square kilometer by dividing it with 1,000,000.
SELECT
  state_name,
  ST_AREA(state_geom)/1000000 AS area_sqkm,
  state_geom
FROM
  `bigquery-public-data.utility_us.us_states_area`
ORDER BY
  area_sqkm DESC
LIMIT
  5
The diagram below highlights the use of BigQuery Geo Viz to visualize the result of our query by plotting it on an interactive web map.
Analysis 2 (ST_WITHIN)
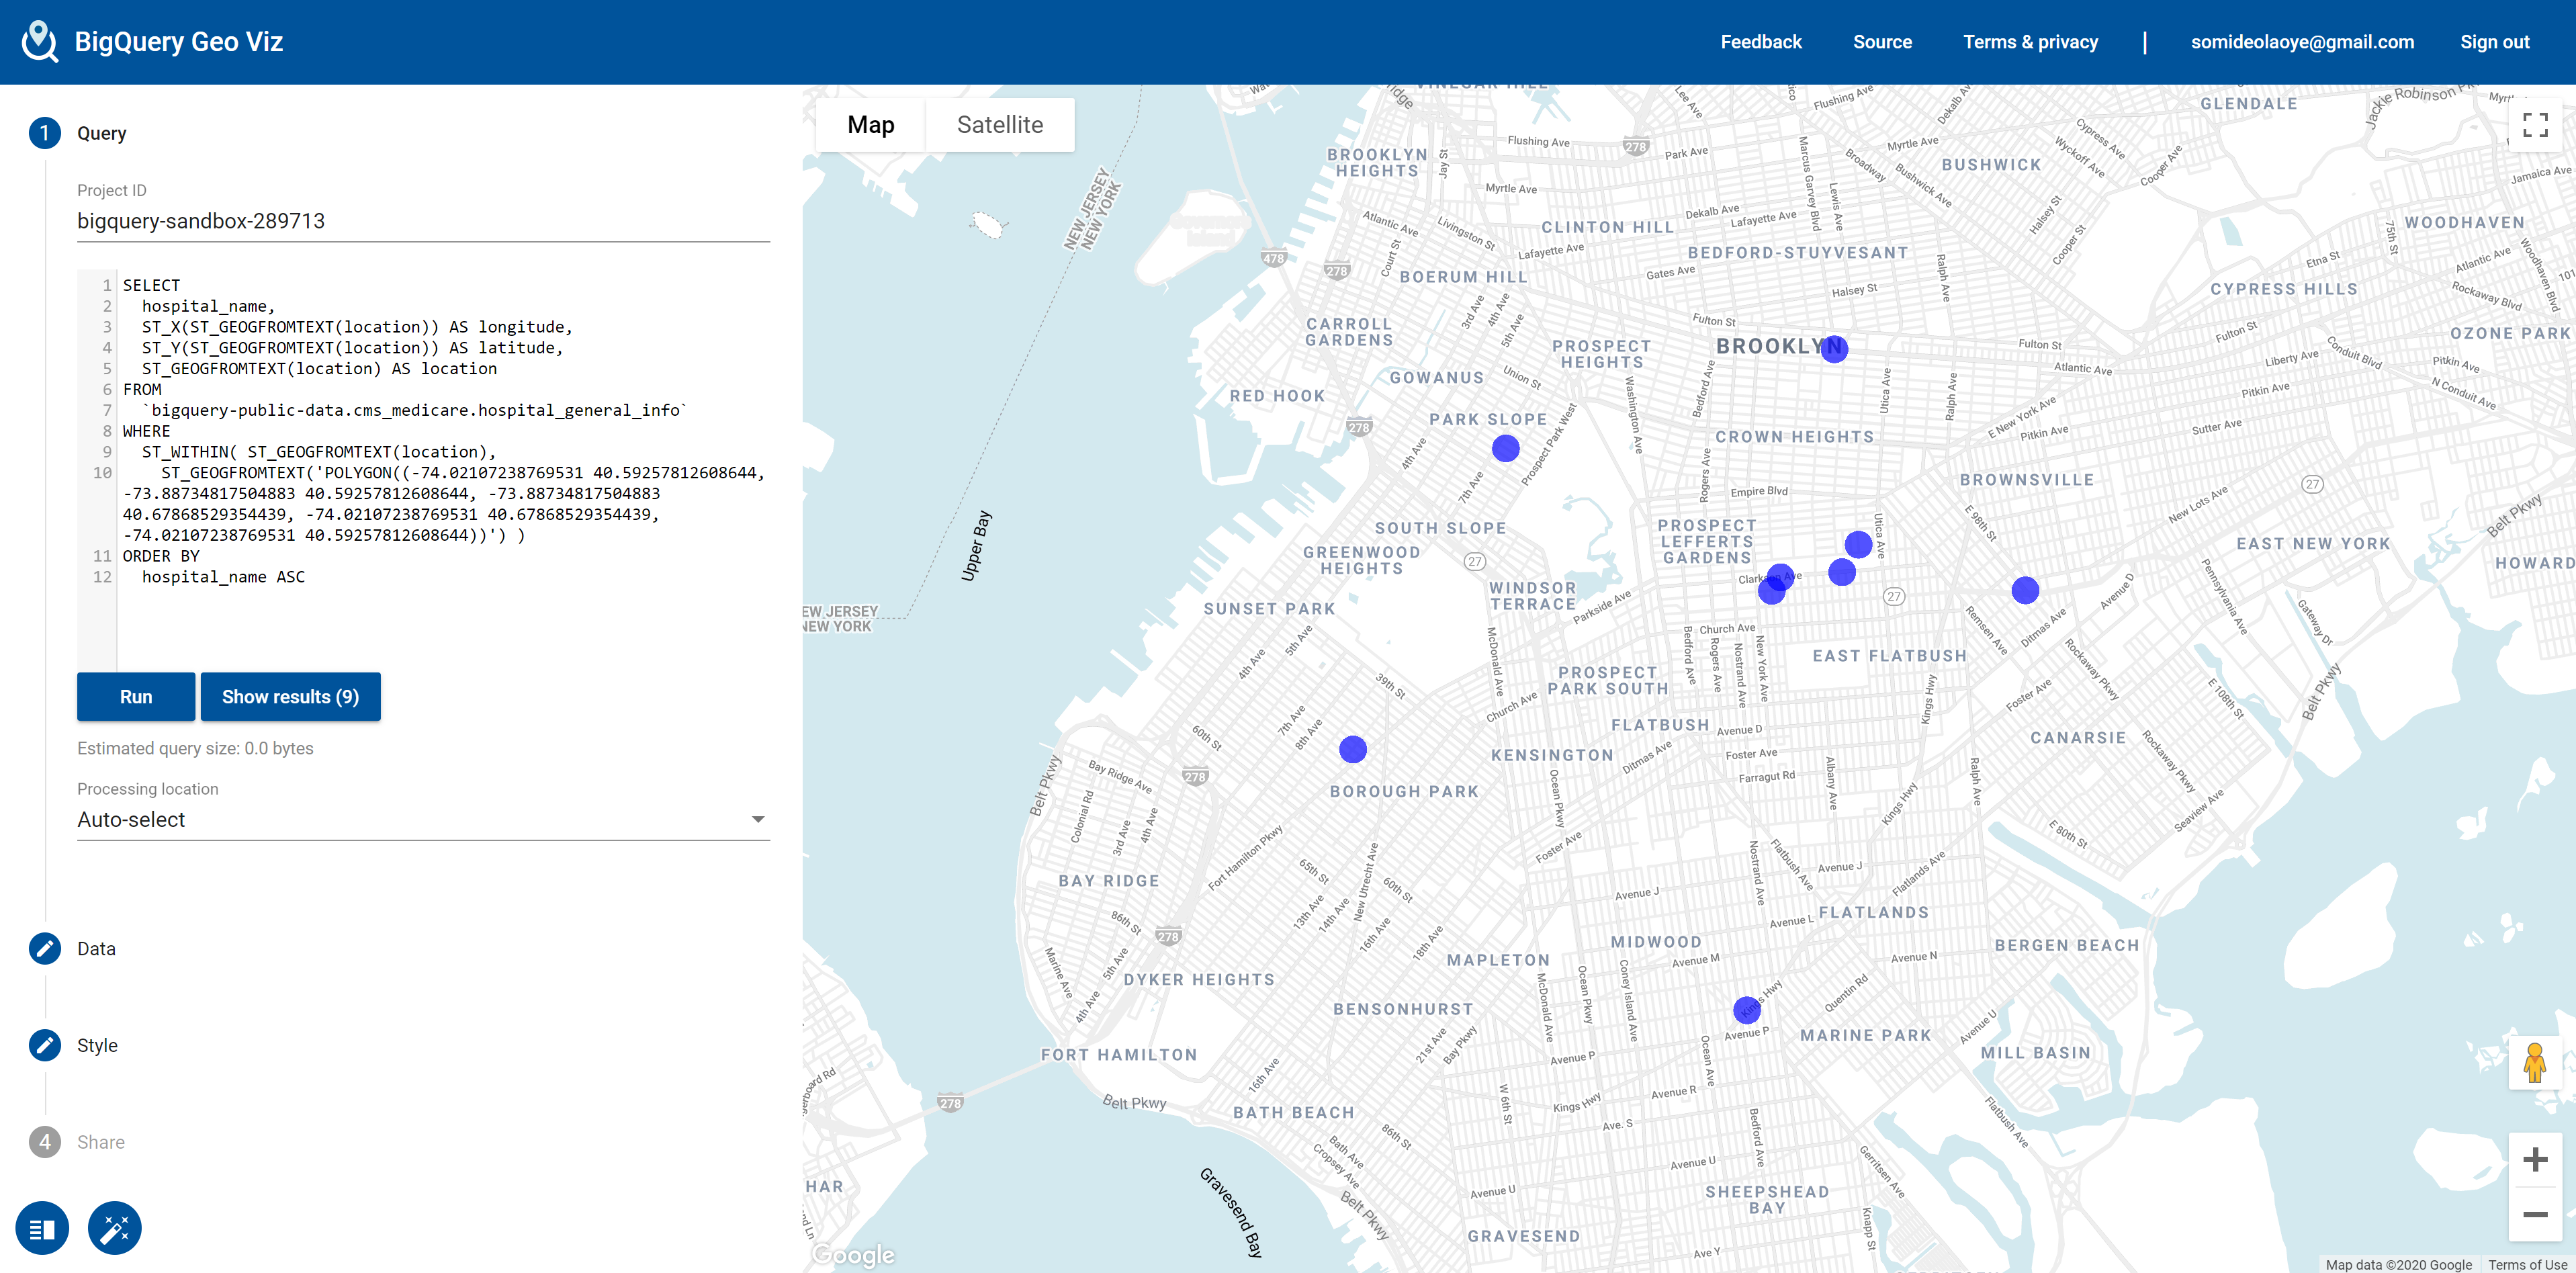
Objective: Find the list of hospitals in the United States that fall within a given perimeter boundary.
For this use case, we make use of the BigQuery GIS function ST_WITHIN. This function returns true if a given hospital falls within the boundary and false otherwise.
By executing the SQL statement below, we get back the list of hospitals that falls within the boundary that we have set.
SELECT
  hospital_name,
  ST_X(ST_GEOGFROMTEXT(location)) AS longitude,
  ST_Y(ST_GEOGFROMTEXT(location)) AS latitude,
  ST_GEOGFROMTEXT(location) AS location
FROM
  `bigquery-public-data.cms_medicare.hospital_general_info`
WHERE
  ST_WITHIN( ST_GEOGFROMTEXT(location),
    ST_GEOGFROMTEXT('POLYGON((-74.02107238769531 40.59257812608644, -73.88734817504883 40.59257812608644, -73.88734817504883 40.67868529354439, -74.02107238769531 40.67868529354439, -74.02107238769531 40.59257812608644))') )
ORDER BY
  hospital_name ASC
As seen below in the diagram, we are able to visualize the hospitals that fall within our set boundary on an interactive map.
Analysis 3 (ST_DISTANCE)
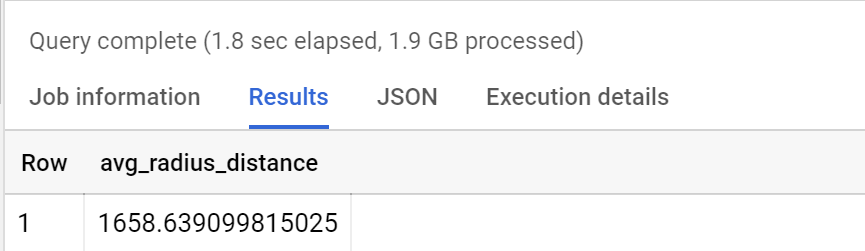
Objective: Determine the average distance is radius covered by all bike trips that started from the "Elizabeth St & Hester St" bike station in 2015.
The dataset used for our third analysis is the NewYork city bike trips from 2014 - 2016. Using the BigQuery GIS function ST_DISTANCE, we were able to compute the radius of the distance of all bike trips that originated from our interested bike station in 2015.
After getting the distance of each trip, we then compute the average of the trips using the SQL function AVG. The result of the average distance covered is in meters.
SELECT
  AVG(ST_DISTANCE(ST_GEOGPOINT(start_station_longitude,
        start_station_latitude),
      ST_GEOGPOINT(end_station_longitude,
        end_station_latitude))) AS avg_radius_distance
FROM
  `bigquery-public-data.new_york.citibike_trips`
WHERE
  start_station_name = "Elizabeth St & Hester St"
  AND EXTRACT(YEAR FROM starttime AT TIME ZONE "UTC") = 2015
Conclusion
It's important to remember that running BigQuery queries on a GCP Project that is connected to a billing account will incur some charges. To avoid these charges, kindly make sure you configure BigQuery Sandbox by disabling billing from the GCP Project you are using to run the queries.
To make it easy to follow along, the datasets used in the query can be found on BigQuery public datasets made available on the Google Cloud Platform (GCP). Except for use cases outside the scope of this tutorial, there is no need to import data from additional data sources.
Many thanks for your time. If you want to chat about GIS data analytics using BigQuery, feel free to connect with me on LinkedIn.
Comments
Join the discussionNo comments yet. Be the first to comment.