


Analyzing data in real-time gives us the opportunity to derive important insights from data and respond to events as they occur.
More than any other topic, COVID-19 was the most discussed topic globally in 2020. Since the beginning of the outbreak, there have been thousands of articles, and millions of messages broadcasted. Twitter is one of such platforms where you can find endless tweets and mentions of the virus.
The objective of this exercise is to create a real-time visualization dashboard of COVID-19 related tweets using Elasticsearch & Kibana. Each tweet will be subjected to a form of natural language processing (sentimental analysis) to determine if the message of the tweet can be classified as positive, negative, or neutral.
1. Application Overview
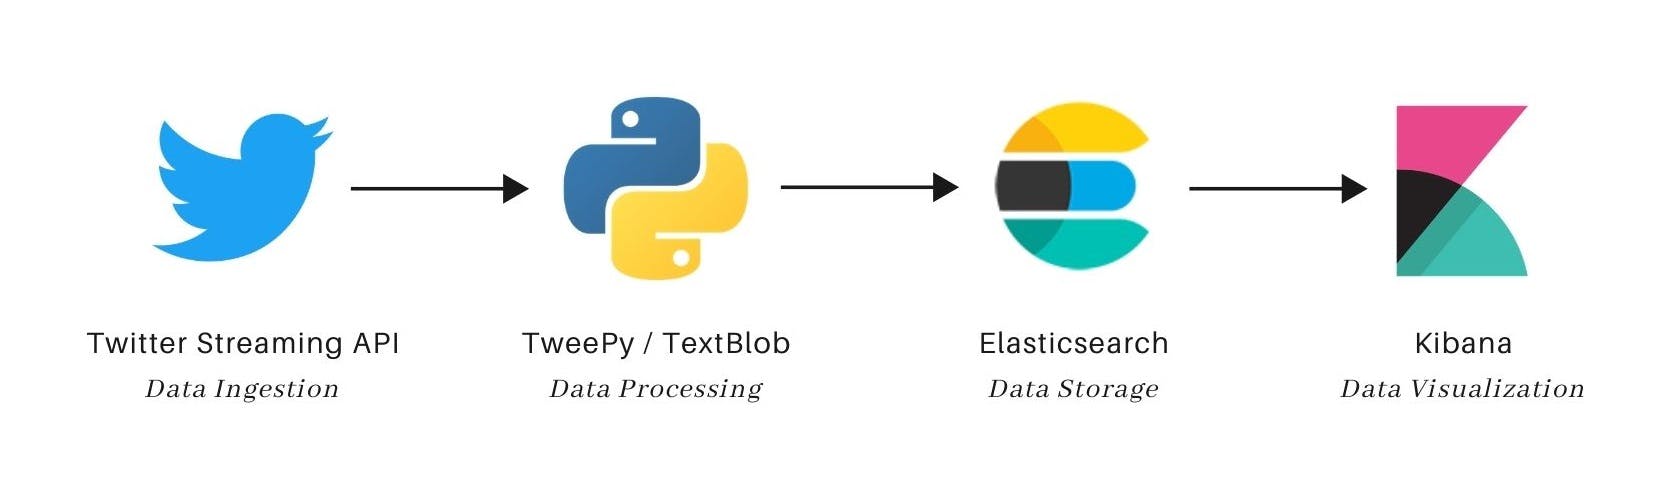
As shown in the diagram below, for this exercise we will make use of various tools that handle different components of the application. We will be using the Twitter Streaming API and Tweepy for capturing and ingesting the tweets, TextBlob for sentimental analysis, while Elasticsearch and Kibana respectively will be used to handle the storage and visualization of data in real-time.
Twitter API & Tweepy: Twitter Streaming API is the primary source of data for this exercise. Tweepy is the Python client library that makes it easier to interact with the streaming API.
TextBlob (NLP): TextBlob is a Python library that provides a simple API for diving into common natural language processing (NLP) tasks such as sentiment analysis, noun phrase extraction, translation, and more.
Elasticsearch: Elasticsearch is a distributed, open-source search and analytics engine for all types of data, including textual, numerical, geospatial, structured, and unstructured. The captured tweets will be ingested into Elasticsearch as a non-relational database.
Kibana: Kibana is an open-source data visualization dashboard for Elasticsearch. It provides visualization capabilities on top of the content indexed on an Elasticsearch cluster.
2. Ingesting data from Twitter
2.1. Creating Twitter Developer Account
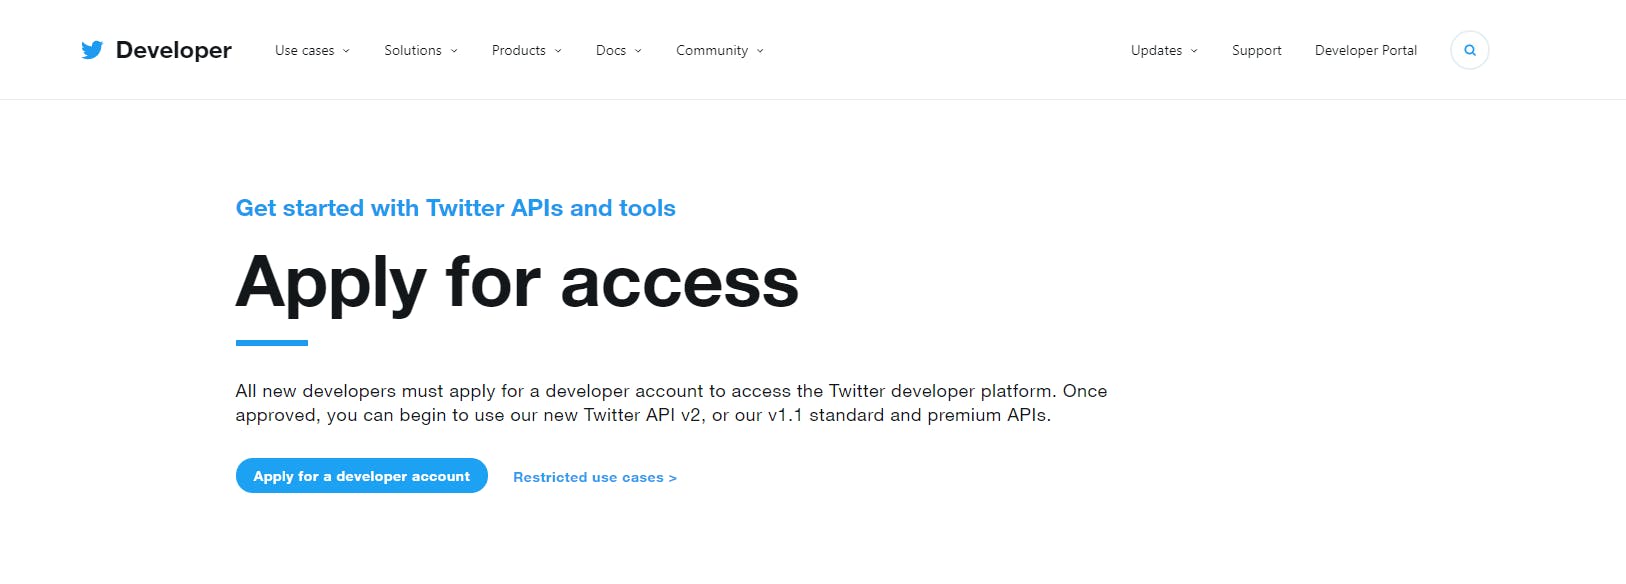
The data ingestion process starts by applying for a Twitter Developer account. Developers that wish to access the Twitter API must apply for a developer account. You can begin to use the API only when the application for a developer account has been approved.
Once the application is approved, you have to create a Twitter App. A Twitter app can be created via the Twitter app dashboard page with an approved developer account. With this App, you can generate all the necessary credentials required for authenticating and streaming data with the API. The needed credentials include the API KEY, API SECRET, ACCESS TOKEN, and ACCESS TOKEN SECRET.
2.2. Setting-up Tweepy for streaming
Tweepy makes it easy to handle all the Twitter Streaming API logistics. You can use the command pip install tweepy to install Tweepy.
The setting-up of Tweepy, requires two main steps:
Creating a StreamListener: the StreamListener class is responsible for handling the actions that are performed on the tweets on arrivals
on_statusand in case of errorson_error.class MyStreamListener(tweepy.StreamListener): def on_status(self, status): # process tweets on arrival print(status.text) def on_error(self, status_code): # handles streaming errors print(f"Encountered streaming error ({status_code})")Creating the Stream: now that we have created the StreamListener, we can now create the actual stream to authenticate with the API and start the data ingestion process.
def main():
  # authenticate twitter api
  auth = tweepy.OAuthHandler(API_KEY, API_SECRET)
  auth.set_access_token(TOKEN, TOKEN_SECRET)
  api = tweepy.API(auth)

  # create a stream
  stream = tweepy.Stream(auth = api.auth, listener=MyStreamListener())

  # filter tweets by keywords
  keywords = ['coronavirus', 'covid19', 'covid vaccine']
  stream.filter(track=keywords, stall_warnings=True)
3. Processing the tweets
As mentioned earlier, using TextBlob we can perform sentiment analysis on each of the tweets received from the streaming API. The objective is to use a form of artificial intelligence known as Natural Language Processing to classify the tweets into different classes (Positive, Negative and Neutral).
The sentiment function of TextBlob returns two properties, polarity, and subjectivity. The polarity property returns a polarity score that is used to determine the sentiment of each tweet. The polarity score is a float that lies in the range of [-1, 0, 1] where 1 means positive statement, 0 means neutral and -1 means a negative.
def get_sentiment(text):
    polarity_score = TextBlob(text).sentiment.polarity
    if polarity_score < 0:
        return 'Negative'
    elif polarity_score == 0:
        return 'Neutral'
    else:
        return 'Positive'
4. Storing data in ElasticSearch
Elasticsearch is a highly scalable open-source full-text search and analytics engine that allows you to store, search, and analyze big volumes of data quickly and in near real-time. For this exercise, Elasticsearch was used as a NoSQL database for data storage.
The process of storing data in Elasticsearch is made up of two major steps:
Creating an Index: an index is the largest unit of data in Elasticsearch, it's a logical partition of documents and can be compared to a database in the world of relational databases. You can have as many indices defined in Elasticsearch as you want. These in turn will hold documents that are unique to each index.
Storing tweets as Documents: a document is JSON objects that are stored within an Elasticsearch index and are considered the base unit of storage. In the world of relational databases, documents can be compared to a row in a table. Data in documents is defined with fields comprised of keys and values. A key is the name of the field, and a value can be an item of many different types such as a string, a number, a boolean expression, another object, or an array of values.
We use the Python Elasticsearch client to interact with the Elasticsearch DB. You may use the command pip install elasticsearch to install the client library.
from elasticsearch import Elasticsearch

es = Elasticsearch([{'host': 'localhost', 'port': 9200}])

es.indices.create(index='my_es_index')

doc = {"_id": 1, "name": "George", "active": True}
es.index(index='my_es_index', id=doc['_id'], body=doc)
5. Visualizing data with Kibana
Kibana is the analytics and visualization platform designed to work with Elasticsearch. It can be used to search, view, and interact with data stored in Elasticsearch indices. With Kibana, you can quickly create and share dynamic dashboards that display changes to Elasticsearch queries in real-time.
5.1. Defining an Index Pattern
Kibana requires an index pattern to access the Elasticsearch data that you want to explore. An index pattern selects the index data to use and allows you to define the properties of the fields. Once the index pattern has been defined, you will have access to every document in every index that matches the selected index pattern.
The image below displays how to create an index pattern that automatically discovers the field attributes and data stored in an Elasticsearch index.
Note: The index pattern name must match the index name defined when creating the Elasticsearch index.
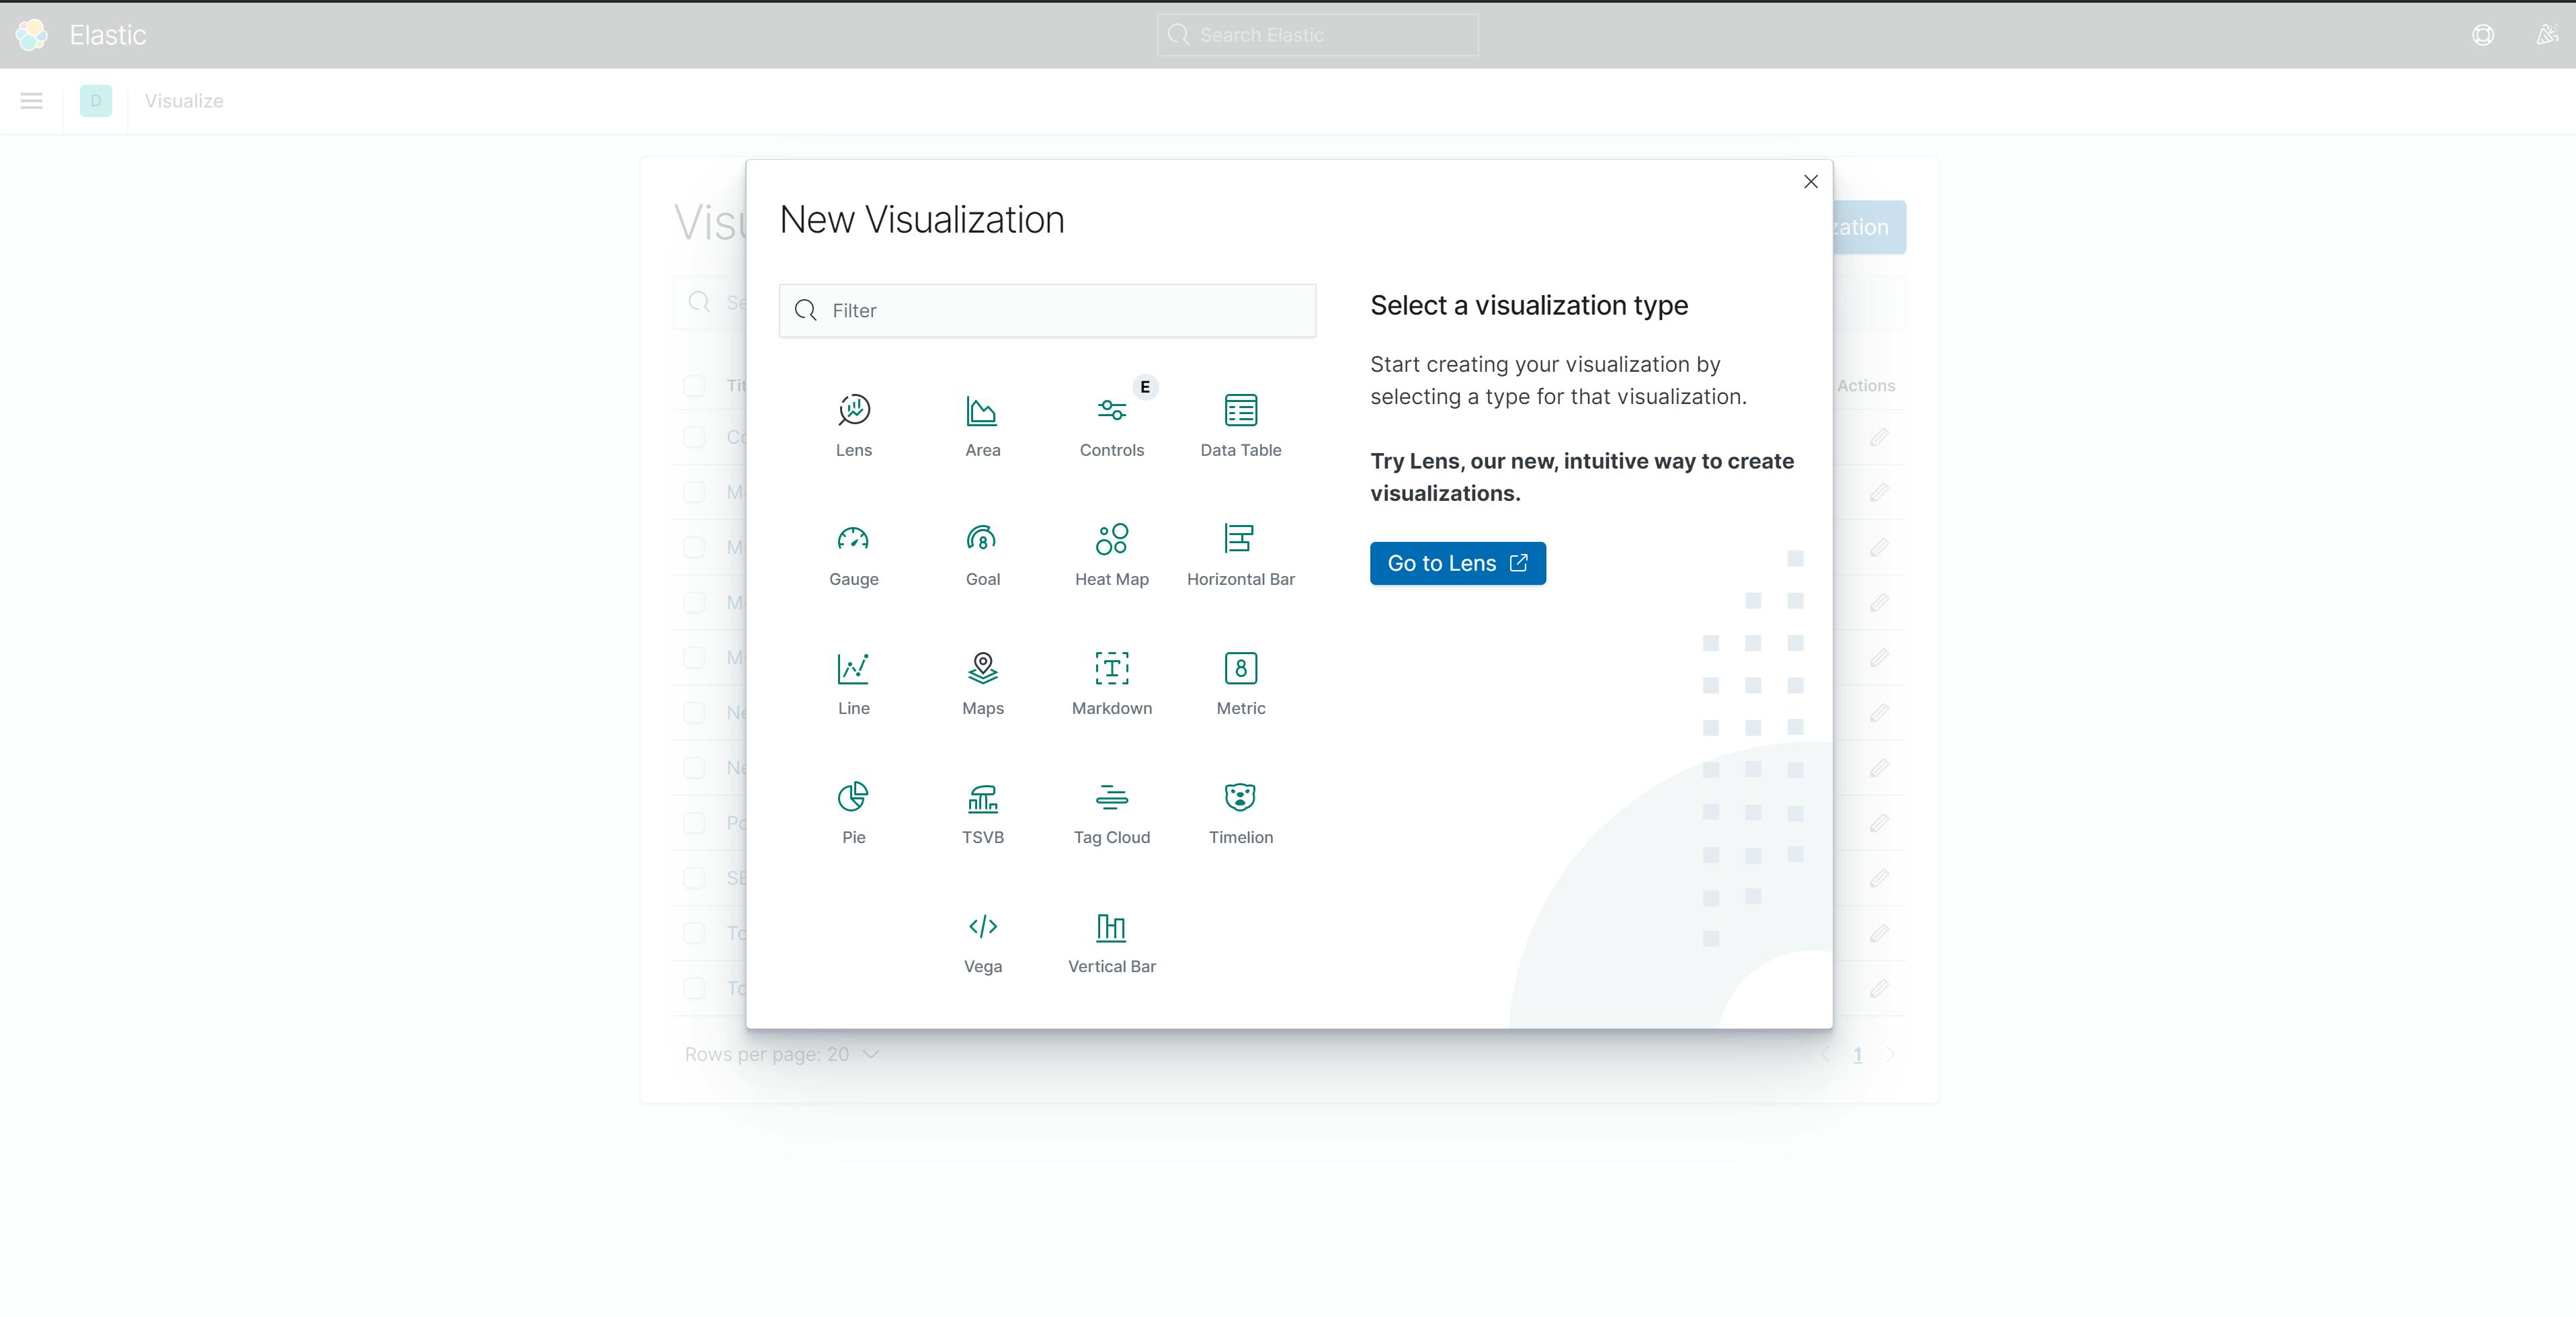
5.2. Creating Visualizations & Dashboard
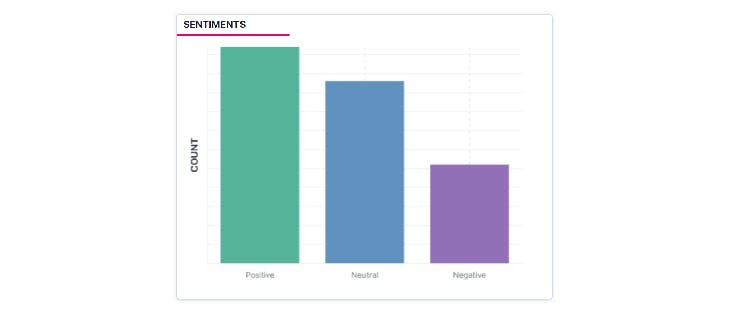
Kibana visualizations are based on Elasticsearch queries. By using a series of Elasticsearch aggregations to extract and process your data, you can create different charts that show you the trends, spikes, and dips you need to know about your data. Kibana supports different visualization types including Maps, BarCharts, PieCharts, Tables, etc.
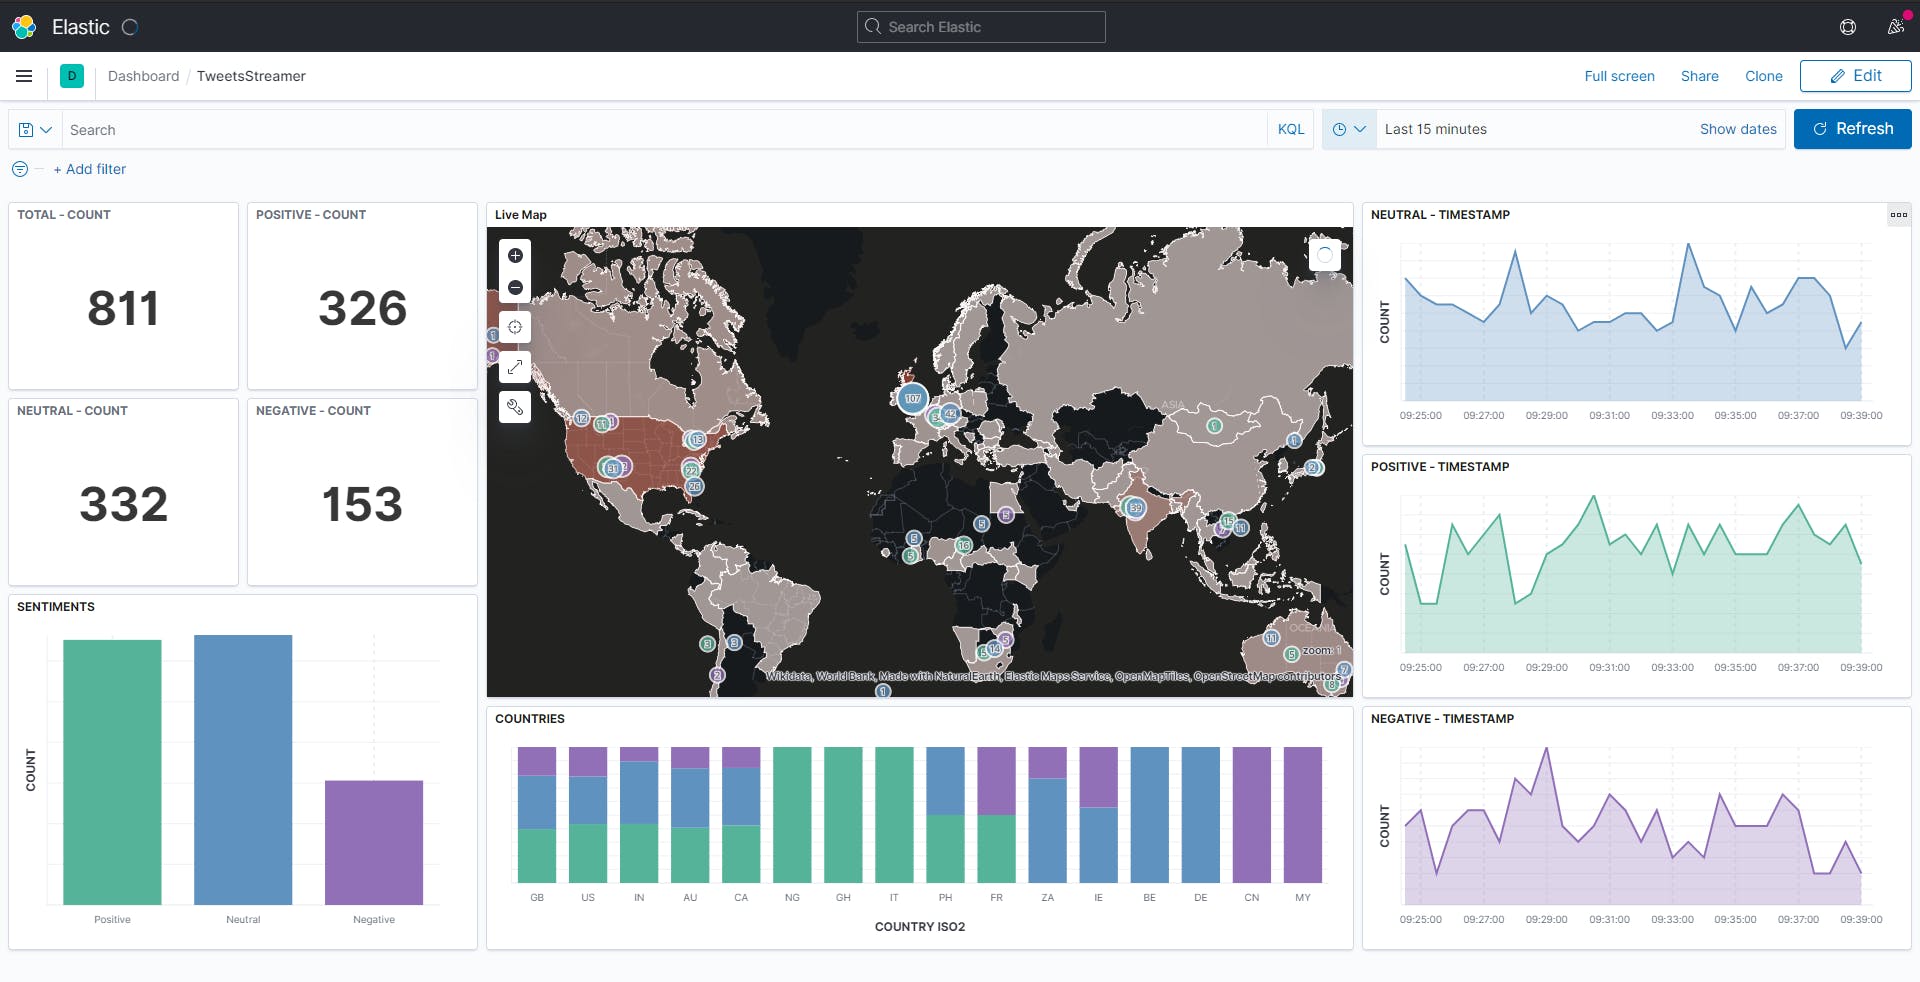
A Kibana dashboard displays a collection of visualizations and searches. You can arrange, resize, and edit the dashboard content and then save the dashboard so you can share it. Once we've finished creating the visualizations for our data, we can build a dashboard that displays related visualizations in real-time.
6. Putting it all together
The streaming, ingestion, and processing of data before storage was handled by the main.py python script which can be found in the GitHub repository for this project.

When the main.py script runs, it populates the Elasticsearch database and automatically displays the new records on the Kibana dashboard in real-time.
Conclusion
In summary for this exercise, we've created a real-time data analytics dashboard of COVID-19 related tweets using Elasticsearch as the data-store and Kibana for visualization of the data.
You can download and install Elasticsearch and Kibana locally from their official download page. To avoid the stress of setting it up locally, you can also make use of the managed version of the ELK Stack deployment on dedicated cloud platforms such as Elastic Cloud, Azure and AWS.